

When considering life’s many changes, one common question arises: how many times does the average person move throughout their lifetime? Moving is often necessary for personal, professional, or financial reasons, and it plays a significant role in shaping our lives. Understanding the typical moving frequency can provide insights into the decisions people make regarding where they live. According to Verified Movers, the average person relocates several times over the course of their life. This statistic can vary based on factors like age, career choices, and family circumstances. Here, we will explore the frequency of moves and the factors that influence how often people pick up and relocate.
How Much People Move?
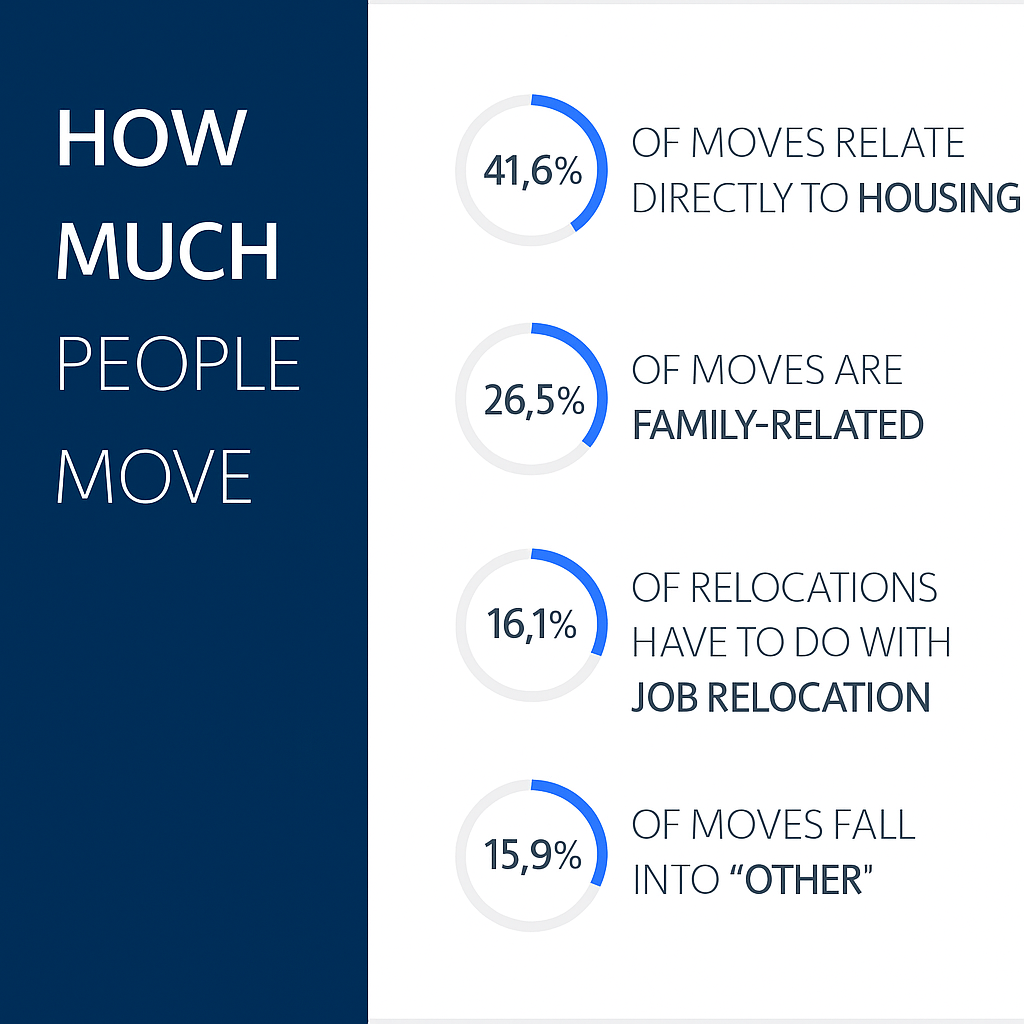
The United States counts among the most mobile countries in the world. One need only look at the stats to realize this. According to the United States Census Bureau, the average person in America will move as many as 11.7 times in their life. The reasons why people relocate vary (and we will delve into that topic later on), but here are the main motivators:
- 41,6% of moves relate directly to the housing.
- 26,5% of moves are family-related.
- 16,1% of relocations have to do with a job relocation.
- 15,9% of moves fall into “other”.
The percentage of Americans relocating has declined over the past decades. In 2000, approximately 16% of the U.S. population moved to a new residence. However, by 2021, this figure had decreased to about 13%, and further declined to 12.6% in 2022. This downward trend is influenced by various factors, including economic conditions, housing market stability, and evolving societal norms. Notably, the millennial generation (aged 25 to 40) has experienced reduced mobility, with migration rates dropping from 14-15% before 2010 to 9.4% in recent years.
The People Who Move
Relocation patterns in the United States vary significantly across different demographics, influenced by age, socioeconomic status, and family circumstances. Young adults, particularly Millennials (aged 25–40) and Gen Z (aged 15–24), exhibit the highest mobility rates. In 2022, approximately 15% of Millennials and 12% of Gen Z individuals moved, compared to only 5% of those aged 60 and above.
One more interesting thing to note is that renters are more transient than homeowners; in 2022, 16% of renters moved, while only 5% of homeowners did the same. This disparity is often due to financial constraints, with renters seeking more affordable housing options.
The trend of “baby chasing” has seen retirees relocating to be closer to grandchildren, reshaping demographic landscapes in certain regions. Additionally, the rise of single-person households, now accounting for 13% of all U.S. households, has impacted housing markets and urban planning.

Why People Move?
As previously mentioned, people relocate for a wide range of reasons. Let’s explore these motivations in more detail.
The most significant reason people move is housing-related, accounting for 41.6% of all relocations. Whether it’s for a bigger home, better neighborhood, or more affordable living, housing remains the top factor driving people to change their residence. Close behind, at 26.5%, are family-related moves, which include getting married, starting a family, or moving closer to relatives. Job-related relocations come in third at 16.1%, with many people moving for job transfers or new opportunities. Interestingly, 15.9% of moves fall into the “other” category, which encompasses a variety of personal reasons like health, lifestyle changes, or retirement.
A notable trend is that many people who move for work end up regretting it. According to a survey that Porch conducted, 25% of people who relocate for a job wish they hadn’t made that decision. Other common reasons for relocation include seeking a better work commute, moving from renting to owning, or finding a safer neighborhood. These statistics show how diverse the reasons for moving are, with significant impacts on individuals’ personal and professional lives.
Kind of Services That Are in Demand
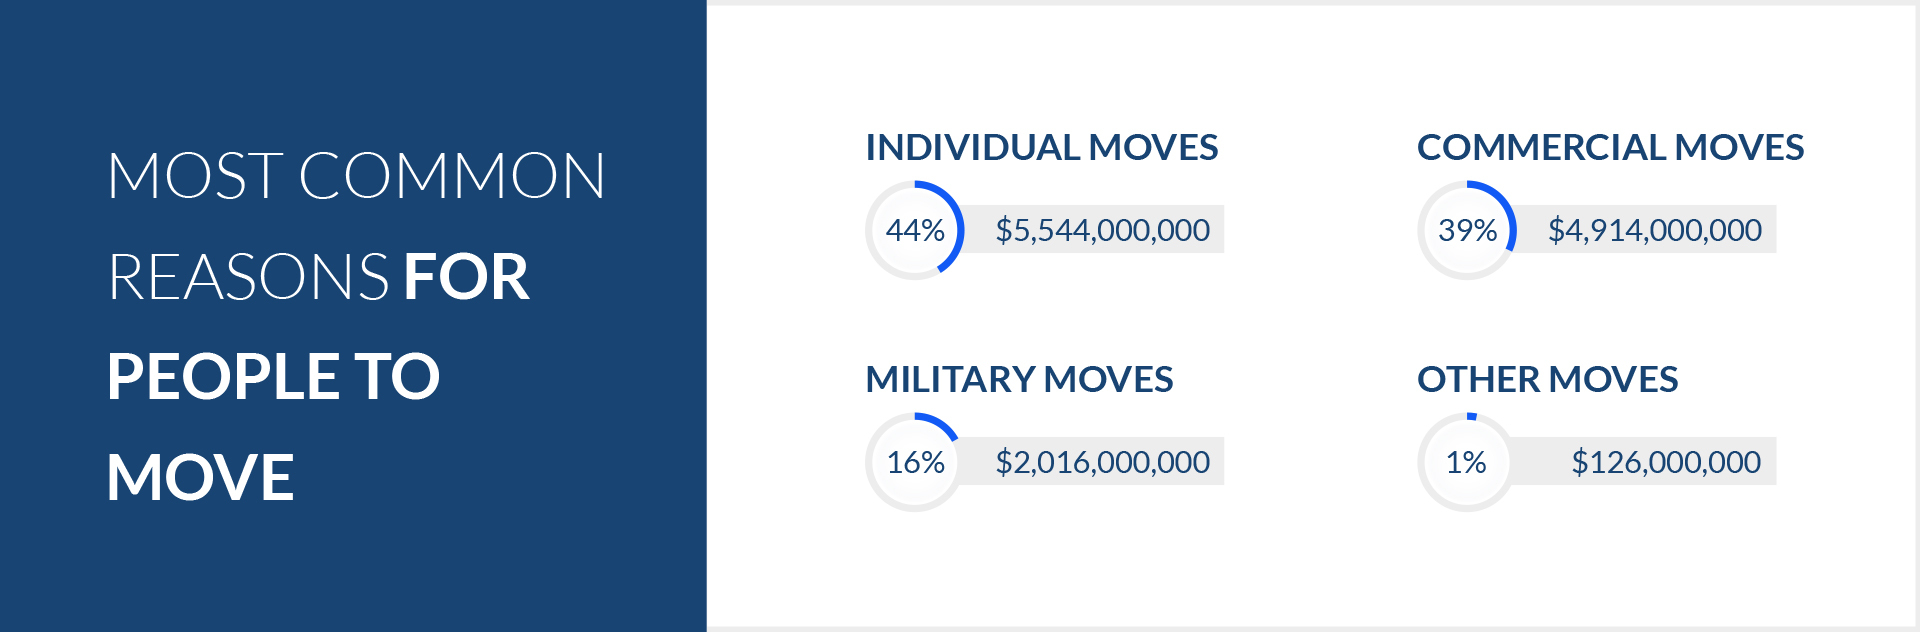
By looking at the money going into particular services, we can understand how often people use them. And the market shares of these various moving services (residential, corporate, military moving, other) reveal that residential moves make up the bulk of the profit pie. But corporate relocations aren’t too far behind, taking up 5% less. For more clarity, here are the revenue stats themselves:
– Individual moves: $5,544,000,000 (44%)
– Commercial moves: $4,914,000,000 (39%)
– Military moves: $2,016,000,000 (16%)
– Other: $126,000,000 (1%)
Where Do People Move?
Now that we have an idea of who tends to move, let’s take a look at where they’re all moving to. As one might expect, the majority of moves happen within the borders of any given state. And it’s a vast majority, too – the US Census Bureau reported that 85% of all moves happen intrastate. Of those, local moving comprises over 60 percent. That leaves a comparatively measly 14% of moves that take place between states and less than a single percent that move overseas.
What’s more, most people don’t end up moving all that far away: the average relocation distance is within a 50-mile radius. Only 24.7% – just shy of a quarter – of people will move to a distance in excess of 500 miles.
There seems to be a pattern in regards to where people move to and from. The most popular states to which people flock are predominately along the coastline and many people are mostly relocating Westward. When viewed together, they almost form a kind of horseshoe, enveloping the coast towns and some of the southernmost states.
The top inbound states of 2024:
- West Virginia
- Delaware
- South Carolina
- District of Columbia
- North Carolina
- Alabama
- Rhode Island
- Oregon
- Arkansas
- Arizona
As you can see, recent data indicates that, for example, Florida’s appeal as a relocation destination has diminished. The decline in inbound migration has impacted the demand for long distance moving companies Florida, leading to increased competition among movers to attract clients.
The Most Moved Out States in the US
Recent migration trends in the United States reveal significant patterns of residents moving out of certain states. Between April 1, 2020, and July 1, 2024, the following states experienced the highest net domestic migration losses:
- California: 2025 migration trends in America show that California lost approximately 1,234,030 residents, with a net migration rate of -37.04 per 1,000 inhabitants.
- New York: Experienced a net loss of 966,209 residents, equating to a net migration rate of -47.82 per 1,000 inhabitants.
- Illinois: Faced a net decrease of 192,209 residents, with a net migration rate of -20.69 per 1,000 inhabitants.
- Hawaii: Saw a net loss of 67,785 residents, corresponding to a net migration rate of -6.73 per 1,000 inhabitants.
- Oregon: Experienced a net decrease of 50,754 residents, with a net migration rate of -34.88 per 1,000 inhabitants.
- Connecticut: Faced a net loss of 47,930 residents, equating to a net migration rate of -8.40 per 1,000 inhabitants.
- New Jersey: Saw a net decrease of 42,234 residents, with a net migration rate of -3.77 per 1,000 inhabitants.
- Rhode Island: Experienced a net loss of 34,497 residents, corresponding to a net migration rate of -4.00 per 1,000 inhabitants.
- Massachusetts: Faced a net decrease of 38,018 residents, with a net migration rate of -3.22 per 1,000 inhabitants.
- Michigan: Saw a net loss of 29,170 residents, equating to a net migration rate of -7.87 per 1,000 inhabitants.
That explains why interstate movers in California and other densely populated states see so much business.
When Do People Move?
According to the statistics, people most often move on Fridays and Saturdays (20% and 18%). That allows them to leave a day or two free for their move without taking to many days off. That also explains why Sunday is the least popular moving day, seeing that it precedes the entire traditional workweek.
Speaking of which, Monday enjoys the title of the second most frequent moving day of the entire workweek. This does run a little counter to the explanation we just gave. However, it does add up when you consider the fact that people come fresh out of an entire weekend’s worth of off time. Therefore, they feel more energized and better prepared to tackle the big move.
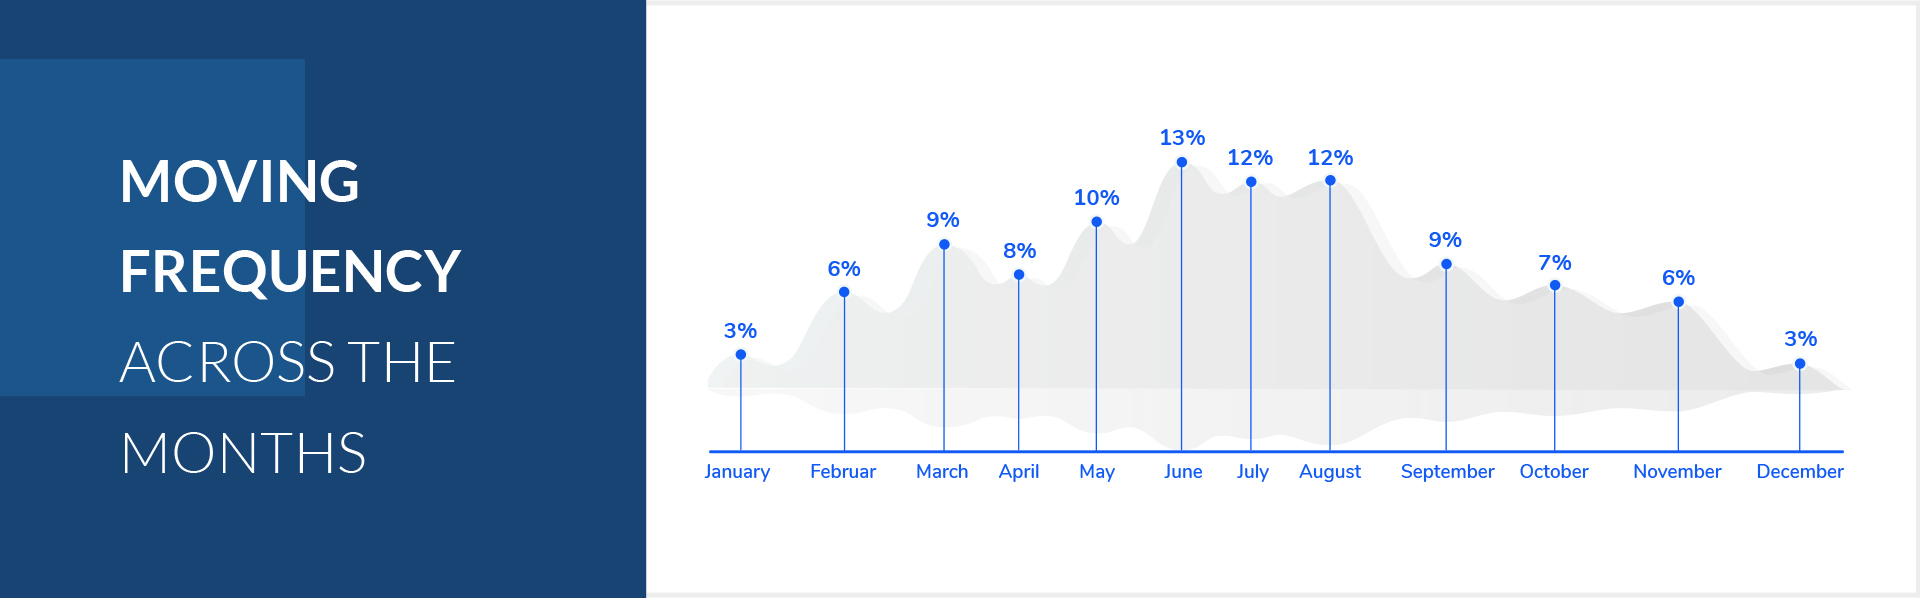
When it comes to the question of the season when people move, summer appears to be the preferred one. As many as 60% of all relocations take place somewhere between May and August. Winter and autumn can be a pain for moving due to the weather, so that serves as a big deterrent. Here’s a breakdown of moving frequency across the months:
- January: 3%
- February: 6%
- March: 9%
- April: 8%
- May: 10%
- June: 13%
- July: 12%
- August: 12%
- September: 9%
- October: 7%
- November: 6%
- December: 3%
Preferred Moving Methods
No matter what your reason for moving is or what kind of move you’re about to undertake (residential, commercial, long-distance, etc.), you really have only three options. These are to hire a professional moving company to do the deed for you from A to Z, organize a DIY move or rent a moving truck to haul your belongings yourself.
If you are planning a relocation, our professional piece of advice for you would be to hire the pros whenever possible. This is because they have the tools and experience to make your move efficient and safe for your things. Of course, there are always budgetary restraints you have to take into account when making such a decision. However, leaving the work to the experts always ensures an overall better moving experience. This is doubly true for something like a move to another state. So if you’re relocating to Colorado, let’s say, you would be smart to find the best interstate movers Colorado can offer you.
Regardless, people in America seemingly don’t want to deal with the expenses of hiring a moving company. We can see that from the data provided by The American Moving and Storage Association. Their research concluded that about 47% of people moving will opt for doing it without any professional help. Meanwhile, 34% of them will rent a truck, and 19% will hire a comprehensive moving service.
The Moving Industry in Economic Terms
The overall market size of the moving industry is approximately $23.2 billion. While it isn’t one of the largest industries in the U.S., it still employs over 114,000 people across roughly 7,300 companies. Since the 2008 Great Recession, the industry has been growing steadily, with a compound annual growth rate (CAGR) of 2.4% over the past five years. In terms of business size, most moving companies are small. Around 47.8% of these businesses operate with five or fewer employees, while just 8.5% employ 100 or more people.
When it comes to revenue distribution, the majority of the income comes from actual moving services, which account for about 69.6% of industry revenue. Storage solutions follow closely behind, making up 20.2%. The remaining revenue is generated by packing services (7.5%) and other related costs (2.7%).
In a fun fact related to storage, there are more self-storage facilities in the U.S. than McDonald’s and Starbucks locations combined. With 52,301 self-storage locations compared to McDonald’s at 13,528 and Starbucks at 16,386, it’s a striking difference. This highlights the significant role self-storage plays in the moving industry.

Hire the Best Moving Companies for You
If you are in the midst of preparing for a move, make sure that you entrust the process to capable hands. After all, a poorly executed relocation can lead to disaster. This especially applies to long-distance moving. That is why the help of the right professional moving company is a godsend. Trustworthy movers will organize and execute your entire move with great speed and care.
Luckily, finding the best in the business is easier now than ever. With the help of Verified Movers, you can easily browse through a wide selection of countless tried and tested moving companies working in your area of interest. Not only that, but you can read about various useful tips and relevant info about every state in the country.
You’ve asked yourself: “How many times does the average person move?” and now it’s time for you to ask: “Who will help me make my move a spotless experience?”