

Regardless of whether you are thinking about moving soon, looking to start your own moving business or just researching for the sake of curiosity, moving statistics can be a valuable source of information. They can reveal recent trends or changes in them, such as which states people are leaving or how they’re moving. This can help you make decisions regarding your own relocation. You should, of course, keep in mind that each relocation is unique and different. But examining state-to-state migration flows can be a great way to start your relocation research and get some basic information on what to expect. To help make this easier for you, Verified Movers have examined the data for last year. We’ve put together everything you need to know about interstate relocation trends right here, so just keep reading!
What is some important general information you should know about moving in America?
If you’ve never moved before, you may be surprised by how much jargon the moving industry uses. You’ll surely come across dozens of terms you’ve never heard before and don’t have a good grasp of. And even if you have some past experience with relocation, it’s worth brushing up on your knowledge before we jump into hard data. So here are some important terms we’ll be using in this text:
- residential moving: a private person or family moving home, changing the address of residence, moving to a new house or apartment where they’ll be living (different from commercial relocation – the moving of a business)
- local moving: moving to a location that is no more than 50-100 miles away from your current home, typically within the same state
- long-distance moving: moving to an address that is more than 100 miles away from your current home, regardless of whether you are staying in the same state
- intrastate moving: moving within the borders of a single US state regardless of the distance
- interstate moving: moving from one state to another, typically but not necessarily long-distance; these moves are specially regulated by the government and require moving companies to have licenses which aren’t required if they operate within a single state
- International moving: moving across the borders of sovereign countries such as the US and Canada, for example
Due to its sheer size, organization as a union of separate states, and domination in the international theatre, the US is a country uniquely characterized by the popularity of all these types of moves, something you don’t see in Europe or Asia, for example. So if you want to look into moving statistics in the US, you’d better have a firm grasp on all these terms!

Learn more about moving through statistics.
Where can you get reliable information on state-to-state migration flows and moving statistics?
Although most moving companies keep their own internal statistics of performed interstate relocations, this data is not comprehensive enough to extrapolate to the entire country. So you will have to turn to other sources for nation-wide moving statistics. One of the best places to look is the United States Census Bureau which has been publishing annual reports on state-to-state migration flows since 2004. You may recognize the United States Census Bureau as the government body in charge of conducting the US census every 10 years (we hope you’re ready for the upcoming one!). As such, they are used to handling large sets of data and crunching important numbers. The one potential downside of relying on their reports is that they can be a bit difficult to read. But that’s why we’re here to interpret them for you!
State-to-state migration flows: the states that people are moving out of
An interstate move must start somewhere. So where did most people start from when moving to another state? In other words: where do most interstate moves originate from and which states are most people moving from? These are the 10 states that gave America the most interstate movers last year:
- California
- Texas
- New York
- Florida
- Illinois
- Virginia
- Georgia
- Pennsylvania
- North Carolina
- New Jersey
The reasons for why people are leaving these particular states vary. In the cases of California, Texas, New York and Florida, for example, high rates of migration are normal given the large population. When it comes to Illinois, on the other hand, poor public policies have been blamed for the mass exodus of people. Other common reasons are high costs of living, poor job opportunities, low-quality housing options and more. To find out the exact reasons for why people are leaving a particular state, it’s best to research the specific state individually.

State-to-state migration flows: the states that people are moving to
Another important number to look at is how many people are moving into each state. So which states were the end destinations of most relocations last year? Here are the 10 states that received the most interstate movers last year:
- Florida
- Texas
- California
- North Carolina
- New York
- Georgia
- Arizona
- Washington
- Virginia
- Pennsylvania
It’s clear that interstate movers in Texas, New York, California and Florida (among others) have been busy with people both moving in and out of these states at very high rates. Once again, this is easy to explain: states with large populations see a lot of migration in both directions. But there are other reasons for moving to these states, too. Americans often move for better job and education opportunities, better housing and better tax laws, for example.

What are state-to-state migration flows telling us?
Every interstate move is one state’s loss and another state’s gain. So when looking for patterns and trends in interstate relocation, we must consider both incoming and outgoing moves. We do this by looking at a single state, assigning a negative value to those leaving it, a positive value to those moving into it and adding those numbers up. If the end result is a positive number, the state is more popular as an inbound location than an outbound one. This state is gaining population. That could mean that the standard of living in the state is good, that moving there is a good idea. If, however, the end result is a negative one, then that means more people are leaving than moving in. This state is losing population which could be a consequence of poor living conditions.
Such information is much more useful than simply looking at sheer numbers, especially when it is expressed on a scale as the number of citizens lost or gained per 1000 residents because it tells us which states are proportionally most or least popular to live in at the moment.
Most popular areas of the US
When we take both incoming and outgoing interstate moves into account, we can easily see which states gained most new residents thus becoming the most popular areas in the US to live in today. So here are the 10 states with the biggest increase in population:
- Arizona (net gain of 83,240 residents)
- Texas (net gain of 82,569 residents)
- Florida (net gain of 69,420 residents)
- North Carolina (net gain of 66,991 residents)
- South Carolina (net gain of 50,775 residents)
- Nevada (net gain of 47,596 residents)
- Washington (net gain of 46,549 residents)
- Colorado (net gain of 43,293 residents)
- Georgia (net gain of 41,914 residents)
- Tennessee (net gain of 39,952 residents)

Expressing these numbers as net gain per 1000 inhabitants changes the list a bit. So here are the 10 states with the fastest-growing populations as well:
- Nevada (15.69 new residents per 1000 inhabitants)
- Idaho (13.74 new residents per 1000 inhabitants)
- Arizona (11.61 new residents per 1000 inhabitants)
- South Carolina (9.99 new residents per 1000 inhabitants)
- Colorado (7.60 new residents per 1000 inhabitants)
- Delaware (7.09 new residents per 1000 inhabitants)
- North Carolina (6.45 new residents per 1000 inhabitants)
- Oregon (6.40 new residents per 1000 inhabitants)
- Florida (6.22 new residents per 1000 inhabitants)
- Washington (6.18 new residents per 1000 inhabitants)
From all this, we can conclude that the West Coast (and the Northwest in particular) and the South (particularly the south-eastern states) are the most popular areas of the US right now. Lower taxes, lower cost of living, better job opportunities and overall better economic growth could be the reasons for this. But one thing is certain: Arizona movers have had a busy season!

Least popular areas of the US
If interstate moving is a competition, then someone has to lose. Indeed, a number of states are closing out the year with fewer residents than they had at the start of the moving season. So here are the 10 states with the biggest decreases in population:
- New York (net loss of 180,306 residents)
- California (net loss of 156,068 residents)
- Illinois (net loss of 114,154 residents)
- New Jersey (net loss of 50,591 residents)
- Louisiana (net loss of 27,914 residents)
- Massachusetts (net loss of 25,755 residents)
- Maryland (net loss of 24,518 residents)
- Connecticut (net loss of 21,509 residents)
- Pennsylvania (net loss of 20,463 residents)
- Michigan (net loss of 16,766 residents)

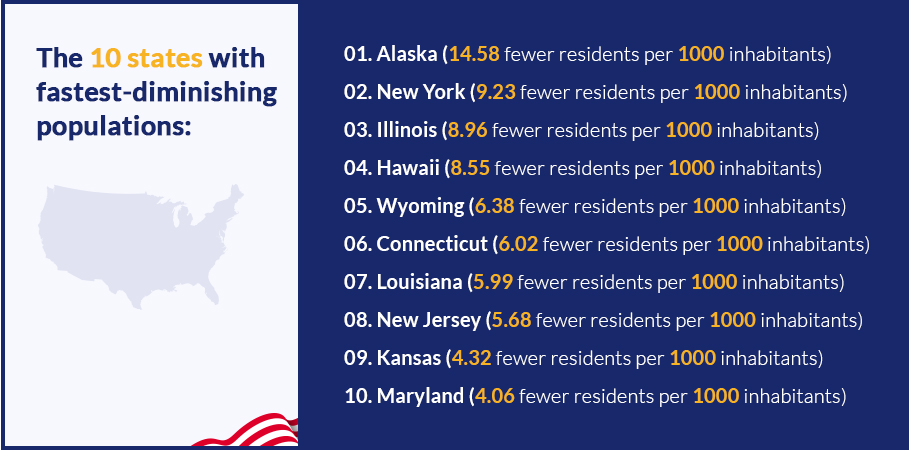
The numbers are certainly concerning for larger states: New York’s interstate movers, for example, have moved the equivalent of a whole town out of state without bringing the same number of people in. But such numbers are often just a drop in the bucket for large states. So let’s scale these numbers to net losses per 1000 inhabitants! This reveals the 10 states with fastest-diminishing populations:
- Alaska (14.58 fewer residents per 1000 inhabitants)
- New York (9.23 fewer residents per 1000 inhabitants)
- Illinois (8.96 fewer residents per 1000 inhabitants)
- Hawaii (8.55 fewer residents per 1000 inhabitants)
- Wyoming (6.38 fewer residents per 1000 inhabitants)
- Connecticut (6.02 fewer residents per 1000 inhabitants)
- Louisiana (5.99 fewer residents per 1000 inhabitants)
- New Jersey (5.68 fewer residents per 1000 inhabitants)
- Kansas (4.32 fewer residents per 1000 inhabitants)
- Maryland (4.06 fewer residents per 1000 inhabitants)
The big reasons for these decreases seem to stem from economic reasons. High prices and taxes combined with few job opportunities are driving people out of these states.

States maintaining a steady population
Not all states experienced major changes in population. Some have maintained a pretty steady population, with similar numbers of people moving in and out. And these are the 10 states with only minor changes in population numbers:
- Alabama (1.17 new residents per 1000 inhabitants)
- Arkansas (0.82 new residents per 1000 inhabitants)
- South Dakota (0.72 new residents per 1000 inhabitants)
- Indiana (0.53 new residents per 1000 inhabitants)
- Kentucky (0.18 new residents per 1000 inhabitants)
- Vermont (0.01 fewer residents per 1000 inhabitants)
- Wisconsin (0.17 fewer residents per 1000 inhabitants)
- Missouri (0.46 fewer residents per 1000 inhabitants)
- Iowa (0.91 fewer residents per 1000 inhabitants)
- Ohio (1.04 fewer residents per 1000 inhabitants)
Keep in mind, however, that these numbers only reflect moving from one state to another. While Vermont movers, for example, may not be doing much business across state lines, local moving within the state may be more prominent.

Most common interstate moving directions
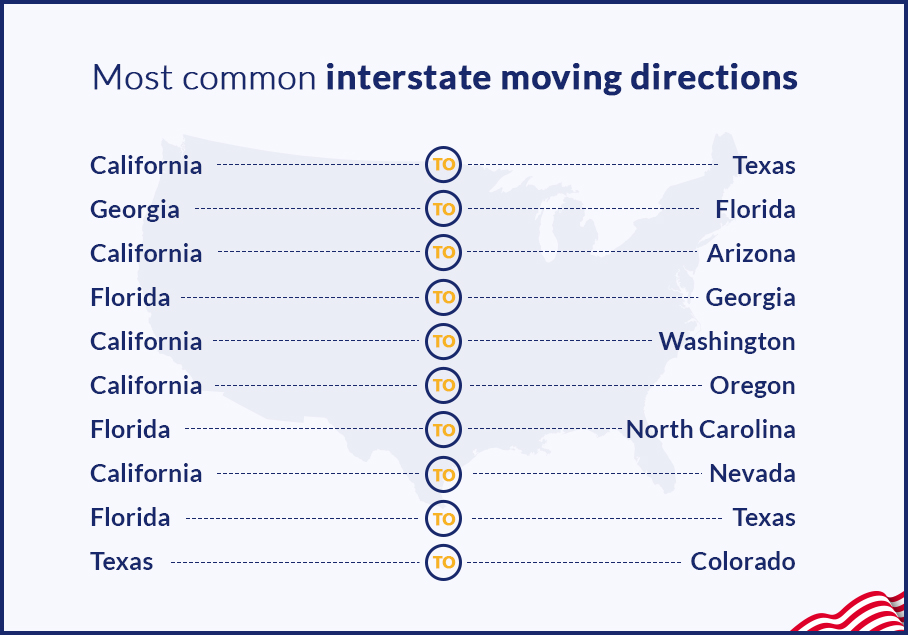
Finally, a statistic worth examining are the directions people are moving in. State-to-state migration flows reveal not only which states lose most population but also who they lose it to. It may also be worth knowing where the new inhabitants of popular states are coming from. In some cases, these migration flows can be good indicators for which states can learn most and who from. So let’s take a look at the10 most common state-to-state moving routes:
- California to Texas
- Georgia to Florida
- California to Arizona
- Florida to Georgia
- California to Washington
- California to Oregon
- Florida to North Carolina
- California to Nevada
- Florida to Texas
- Texas to Colorado
Obviously, California interstate movers have been quite busy. That’s not really surprising, considering California is one of the states where most interstate movers came from last year. But there’s another vast area that stands out on this list: the South. The South has seen a lot of migration in recent years, most in its favor. In fact, Southern states have noted an increase in population almost every year since 1981. In 2018 alone, around 1.2 million people moved to the south while only 714,000 people moved away. Of those moving to the South, 412,000 came from the Northeast, 356,000 from the Midwest, and 459,000 from the West, making these some of the most common interstate relocation directions. Among those leaving the South, 317,000 went to the West and 276,000 to the Midwest, accounting for some more common migration flows.

State-to-state migration flows for some of the largest states
Among the states with the highest numbers of incoming movers are Florida, Texas, and California, the end destination for more than half a million relocations each. Florida received the most people from New York (63,700). Closely following are Georgia (38,800) and Texas (31,600). Texas, on the other hand, was the location for those moving from California (63,200), Florida (33,700) and Louisiana (28,700). Finally, California welcomed former residents of Texas (41,000), New York (34,300) and Washington (33,100) more than any others.
Among the states with the highest numbers of outgoing movers are California (more 661,000), Texas (467.300) and New York (452,600). Californians moved primarily to Texas (63,200), Arizona (59,200), and Washington (52.500). Texans, on the other hand, chose California (41,000), Oklahoma (31,400), and Florida (31,600) as their destinations. Finally, New Yorkers sought a better life in Florida (63,700), New Jersey (57,200), and Pennsylvania (40,300).
More 2019 moving statistics you may find interesting
State-to-state migration flows are not the only interesting moving statistics for last year. So here’s some more informational data that can help you learn more about moving in America!
Intrastate vs interstate relocation
While millions of people moved from one state to another, many more stayed in their own state. In fact, local and city-to-city moving in a single state accounted for far more relocations than interstate moves. Indeed, of more than 32 million relocations performed last year, approximately 85% were within state lines. In contrast, only 15% of Americans on the move went to another state.
Assisted vs unassisted relocation
Where people are moving is far from the only relevant question. What you should also be asking yourself is how people are moving. This is one of the first things you have to decide when preparing for a move. And the answer may surprise you. According to the latest data, only 19% of Americans hire top moving professionals for help. Of the remaining 81%, 34% rent a truck and do the rest of the work themselves while 47% move without any assistance at all.
Using state-to-state migration flows and moving statistics to answer some of your most common questions
Whatever your interest in moving is, you probably have a lot of questions. Luckily, state-to-state migration flows and other moving statistics can help answer some of the most common ones. So let’s take a look at some of the most frequently asked questions about moving in America!
How many people are relocating in the USA?
Millions of Americans relocate every year. In 2018, the exact number of people who changed their address was 32,252,000 people. That’s 10.1% of all Americans and more than the entire population of many countries. But that number barely compares to previous years. In fact, Americans are moving less than any previous year since 1998. Back then, as many as 16% of all Americans relocated. Despite minor spikes in 2002 (14.8% compared to previous year’s 14.2%) and 2009-2010 (12.5% compared to 2008’s 11.9%), that number has been more or less steadily declining ever since. This year’s numbers reflect the trend and are the lowest in two decades.

Despite millions of relocations, fewer people moved this year than in the last 20 years.
How many people are moving to America?
State-to-state migration flows aren’t the only relevant border-crossing that happens in the US. International moving is also common. Thousands of foreigners move to America every year. In turn, thousands of Americans leave for other countries as well. The number of foreign-born US citizens (around 15 million) and immigrants (around 45 million) living in America is at an all-time high. Most of them (about a quarter) come from neighboring Mexico. But many people from China and India are also moving to the US today. Former residents of the Philippines are not far behind either.
How many people are moving from America?
When it comes to Americans, a negligible 0.4% (or around 1,276,000 people) moved abroad. Around 40% stick to the American continent and relocate to Canada, Central and South America. Approximately 26% move to Europe. Even fewer, around 14%, move to East Asia and Oceania. Another 14% choose the Middle East. Finally, Central/South Asia and Africa receive around 3% of American international movers each. The most common reasons given by Americans for moving abroad are work, education, retirement, and marriage.
Who is moving the most?
In 2018, only 44% of relocations were individuals or families moving for private reasons. Business moves followed close behind with 38% of all relocations. Military relocations accounted for a further 16 % of moves. Finally, 2% of all moves were government agencies. A surprising statistic on who is (or rather, isn’t) moving are millennials. This generation is moving less than all previous generations of Americans. In fact, as many as 38.4% of adults ages 18-34 still lived with their parents according to a survey from 2017. This could explain the declining rates of moving overall.
When do Americans move?
It is common knowledge that summer is peak moving season. During the summer months, movers are booked out well in advance and moving rates are higher than otherwise. But when exactly do most people move? In 2018, the busiest month was June, A total of 13% of all moves happened then. July and August were close behind with 12% each and May saw 10% of all relocations. The further away from the middle of the year we look, the lower the percentage gets. September and March accounted for 9% of the moves each while 8% were performed in April. October followed close behind with 7% of all moves. February and November, meanwhile, saw 6% of the moves each – half that of the busiest months. Finally, December and January are the least popular months for moving: only 3% of the moves happened in each of these months.
What is the average cost of relocation in America?
The question that plagues all movers is this: How much can I expect my moving estimate to be? And here is the answer:
- the average cost for an intrastate move in America is $980
- the average cost for an interstate move in America is $4,100
The exact price, however, varies depending on the distance and the size of the shipment.
What are the most common reasons for moving in America?
Americans move for a wide variety of reasons. Many are financial – related to their jobs or the economic conditions in their current state. But just as many are personal, related to family or a change in their life. Here are the reasons Americans gave for moving in 2018:
- looking for a new or better home – 16.4%
- establishing own household – 12.6%
- unspecified family reasons – 11.1%
- new job or job transfer – 10.3%
- looking for cheaper housing – 7.9%
- buying a home after previously renting one – 7.3%
- other housing reasons – 6.7%
- easier access to work or shorter commute – 5.6%
- other reasons – 5%
- marriage or divorce – 4.4%
- attending or leaving college – 2.8%
- looking for a better neighborhood – 2.6%
- health-related reasons – 1.8%
- looking for a new job – 1.5%
- other job-related reasons – 1.1%
- retirement – 1.1%
- evicted out of their old home – 0.7%
- wanted a change of climate – 0.7%
- natural disaster – 0.5%

How can tracking state-to-state migration flows be useful to you?
All this information should satisfy some of your curiosity about moving. But there are plenty of other things that state-to-state migration flows can tell you. If you’re thinking about moving, for example, statistics can tell you which states you should consider and which you should avoid. The reasons for moving can also reveal interesting information as to why you may want to move. Finally, knowing how other people move can help you make the right decisions about your own move such as when to relocate and whether to hire movers or not.